

Last week I was ranting about the albums chart, with my main thesis being that it isn’t what it used to be. This week, I have the data to prove it.
As I mentioned last week, I had to collect this manually. I noted down the top 100 albums for the charts that were valid on 1st November 2001 and 1st November 2026. As well as the chart position, title, artist, and number of weeks on the chart (as of the chart date), I also found from other sources1 the release date, and whether or not it was a compilation or greatest hits album.2 Let’s have a look at what that tells us.
I’m going to start by looking at how long ago the albums came out, as of the relevant chart date. Since we’re talking about age, I thought it might be fun to show that via a population pyramid, because I have a strange idea of fun.
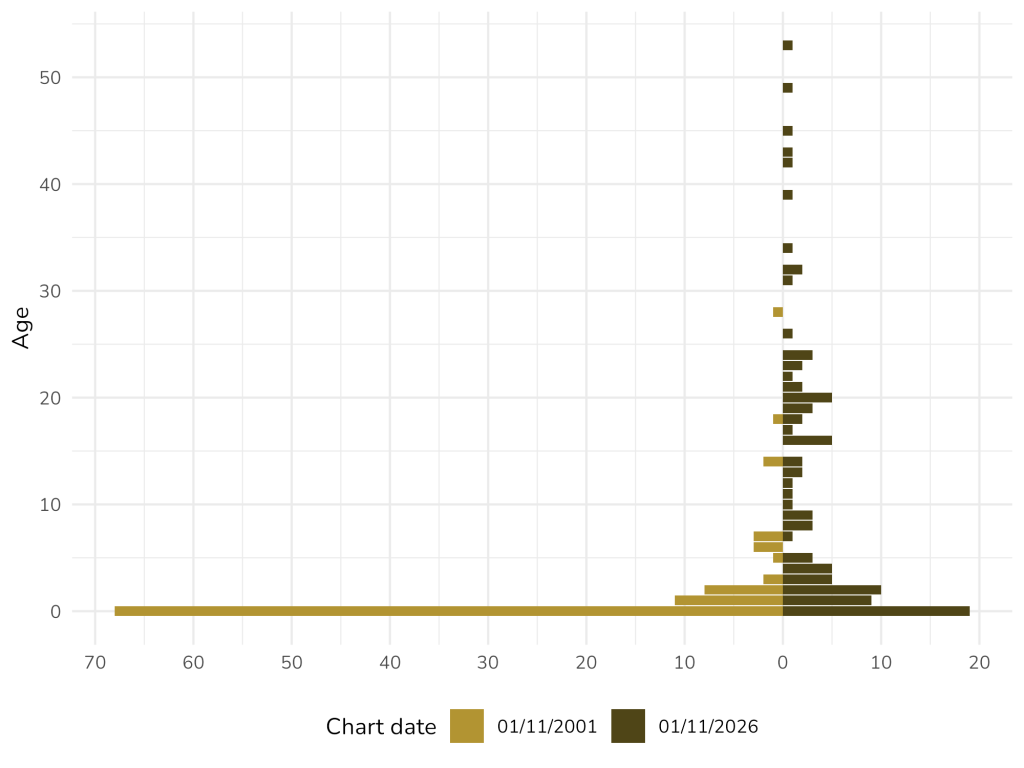
Back in 2001, more than two-thirds of the albums on the chart (68, to be precise) had come out within the previous year, and almost all were in the preceding 10 years. There were only, in fact, four albums in the charts dating back to the 1980s or earlier: two by Michael Jackson (Thriller and Bad), one by U2 (The Joshua Tree), and the oldest, Goodbye Yellow Brick Road by Elton John, which was a venerable 28-year-old.
In the chart from 2026, the share of what, for want of a better word, we’ll call “newborn” albums had dropped from more than two-thirds to less than one-fifth. Actually, there were fewer albums with a single-digit age in 2026 (58) than there were newborn albums in 2001. The 10-year cutoff from 2001 is now more analogous to a 40-year cutoff: there were five albums older than that in the chart from this year. (You can probably guess who they’re by: have a guess, then have a look in the footnote to see how well you did.3) And the thing I find interesting about that is that the threshold has moved by more than time that has passed between the charts: it’s not just that the same old stuff is hanging around, but that the content is getting actively older.
As I probably should have guessed, the ”number of weeks on the chart” variable correlates heavily with the age one, so doesn’t really tell us much new.
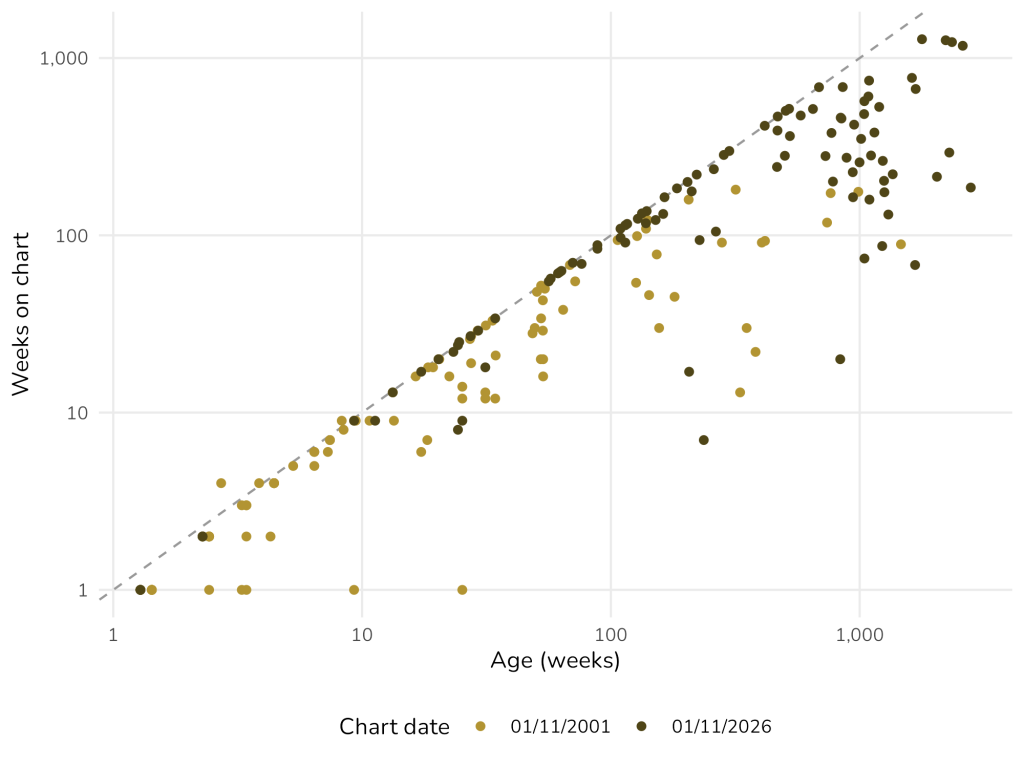
However, I did think it might be interesting to see, for the top five songs, how many weeks they’d spent on the chart as of 1st November 2001. That required a little more data collection for four of those albums, because they weren’t actually in the chart on that day. But I was happy to oblige.
| Artist | Album | Weeks as of 01/11/2026 | Weeks as of 01/11/2001 | Difference | Percentage |
|---|---|---|---|---|---|
| ABBA | ABBA Gold: Greatest Hits | 1,277 | 432 | 845 | 65% |
| Bob Marley and the Wailers | Legend | 1,260 | 432 | 828 | 63% |
| Queen | Greatest Hits | 1,230 | 540 | 690 | 53% |
| Fleetwood Mac | Rumours | 1,173 | 500 | 673 | 52% |
| Oasis | (What’s the Story) Morning Glory? | 773 | 181 | 592 | 45% |
The 2026 chart is exactly 1,305 charts later than the 2001 one, so the percentage column shows the fraction of intervening charts that each album has appeared on. Which leads to the rather astonishing conclusion that ABBA Gold has appeared on almost two-thirds of the charts issued in the last 25 years. I mean, it’s a good album, but what’s going on?
Now is probably time to talk about the elephant in the room: the greatest hits albums. Here’s what I like to call a barcode graph: the horizontal axis progresses from the top of the chart on the left to the number 100 on the right, and each bar “lights up” in yellow if the album at that position is a compilation.
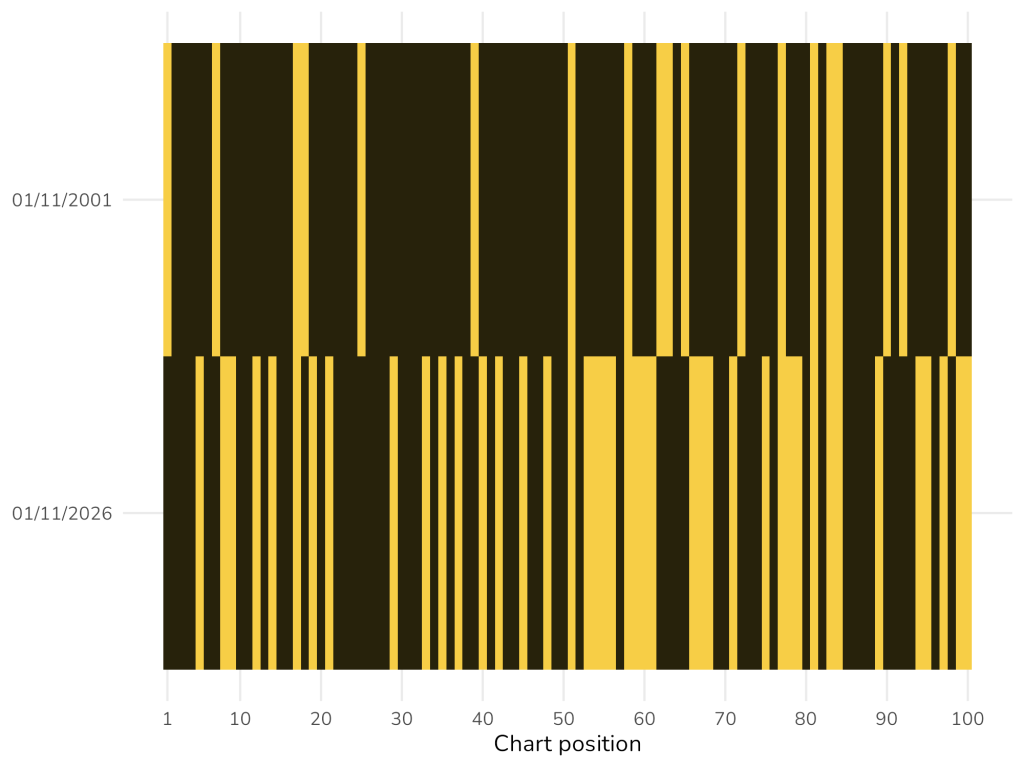
I don’t think I need to comment much on this one.
So what’s going on? I don’t know exactly, but I have a guess: streaming.
The distinction between the singles and albums charts made sense when singles ran at 45 rpm and albums at 33⅓.4 Cassette and CD singles might have looked the same, but you could still distinguish them by length. Even in the download era, where the distinction between downloading a “single” and downloading a single track from an album became blurred, you could at least tell whether someone had purchased the whole thing or just a bit of it.
But what exactly do you count as one stream of an album? Have a think about it, because from trying to come up with a way myself I don’t envy the Official Charts Company. As an example: suppose someone streams a playlist of top ABBA tracks. At first that’s probably functionally equivalent to streaming ABBA Gold—but as they go down the list they’ll start to tick off some of the earlier albums from which the songs were taken. At that point, should you take the compilation album back off the list?
Fortunately, the Official Charts Company tells you how they do it. And I’ll tell you more about that next week.
To be continued…
- Let’s be honest: mostly Wikipedia. ↩︎
- This last one required some judgement. For example, technically, last year’s I’ve Tried Everything but Therapy by Teddy Swims is a compilation album, because most of its tracks are from two EPs. But those EPs came out in 2023 and 2025, and had the same title but with “(Part 1)” and “(Part 2)” appended, so it hardly seems fair to count it against him. ↩︎
- The Beatles (1967–1970), Bob Marley and the Wailers (Legend), Fleetwood Mac (Rumours), Queen (Greatest Hits) and Michael Jackson (Thriller again). Notice that three of those are compilation albums, a topic we’ll come on to. ↩︎
- I’ve always wondered why the extra one-third. But it means that each revolution takes exactly 1.8 seconds, which to be honest doesn’t really explain it. ↩︎
Leave a Reply